Source
Most of the videos are come from the eDX math course: https://www.edx.org/course/introduction-to-data-science
Notation
Source:
- https://ml-cheatsheet.readthedocs.io/en/latest/math_notation.html
- https://www.deeplearningbook.org/contents/notation.html
Greek alphabet
| Letter | Name | Letter | Name |
|---|---|---|---|
| Α α | alpha | Β β | beta |
| Γ γ | gamma | Δ δ | delta |
| Ε ε | epsilon | Ζ ζ | zeta |
| Η η | eta | Θ θ | theta |
| Ι ι | iota | Κ κ | kappa |
| Λ λ | lambda | Μ μ | mu |
| Ν ν | nu | Ξ ξ | xi |
| Ο ο | omicron | Π π | pi |
| Ρ ρ | rho | Σ σ/ς, Ϲ ϲ | sigma |
| Τ τ | tau | Υ υ | upsilon |
| Φ φ | phi | Χ χ | chi |
| Ψ ψ | psi | Ω ω | omega |
Algebra
| Symbol | Description | Example |
|---|---|---|
| $a$ | A scalar (integer or real) | $a=3$ |
| A | A scalar constant | A = 3 |
| A | a matrix, a tensor | $A = $ |
| (f∘g) | a nested function (compose function) | $f(x)=x^2-6x+2$ $g(x)=-2x$ $(f\circ g)(x)=f(g(x)) = (-2x)^2-6*(-2x)+2$ |
Probability
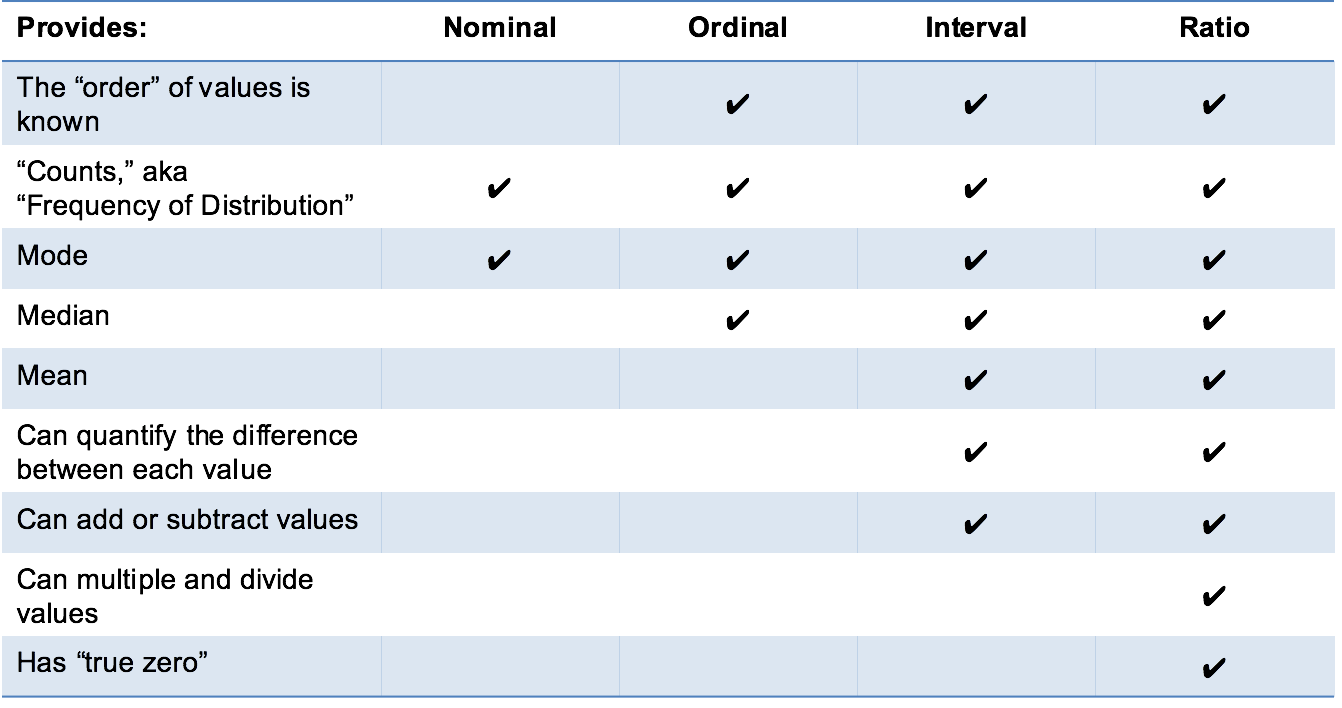
Data Types in probability link1link2
http://www.mymarketresearchmethods.com/types-of-data-nominal-ordinal-interval-ratio/
| Name | Description |
|---|---|
| Nominal | When the value doesn't have any connection with the data. It is just for codification. * gender (1-male, 0 -female) |
| Ordinal | When values have some order. * degree (A,B,C,D,E) * position (1st,2nd,3rd) |
| Interval | Numeric values with 0, but scale is not equal (0 doesn’t mean the absence of temperature, Celcius has no such thing as “no temperature ” ) * Faranheit scale * Celcius scale (30 Celcius is not twice as high as a temperature of 15 Celcius) |
| Ratio | There is nominal difference between values (4 is equal 2 * 2). Values has true 0 * Kelvin scale (300 Kelvin is twice as high as a temperature of 150 Kelvin) * Weight * Size * Speed |
Probability video
Probability is an estimation that some of that will occur in a random experiment.
| Sample | Events of Interest | Probability |
|---|---|---|
| $S = { head, tails}$ or $S = {H,T}$ $S={1,2,3,4,5,6}$ | $E={H}$ $E={odd}$ - all odd values | $P(H)=\dfrac{1}{2}$ $P(odd)=\dfrac{1}{6}$ |
Axioms of Probability
- $P(A)≥0 P(A)$ is always greater or equal 0
- $P(S)=1$ Probability of all samples is equal 1
- $P(A,or ,B)=P(A \cup B)=P(A)+P(B)-P(A,and,B)$
- if $AB={}, P(A \cup B)=P(A)+P(B)$ Probability of mutual exclusive events are sum of probability of each event. Because $P(A,and ,B)=0$
Mutual exclusive video example ↶ Example
html source
Example
Mutual exclusive is when one event occur and it is impossible for event B to occur. For example event A = {2,4} and event B = {3}. it is impossible to get both events in one shot.
$P(A,or,B)=P(A \cup B)=P(B \cup A)=P(B,or,A)=P(A)+P(B)-P(A,and,B)$
Probability of (A or B) is a sum of probability of each of them minus probability of draw both of them. Or probability is alternate.
Law of Complementvideo
$P(\overline{A})=1-P(A)$ Porbability of complement of a set A is 1 - probability of the event A. FOr example probability of NOT draw an odd is *$1-P(odd)$
Joint Probabilityvideo
$P(A,and,B)=P(B,and,A)=P(A \cap B) = P(B \cap A)$. Joint probability is alternate.
$P(A\cap B)=P(A|B)*P(B)$
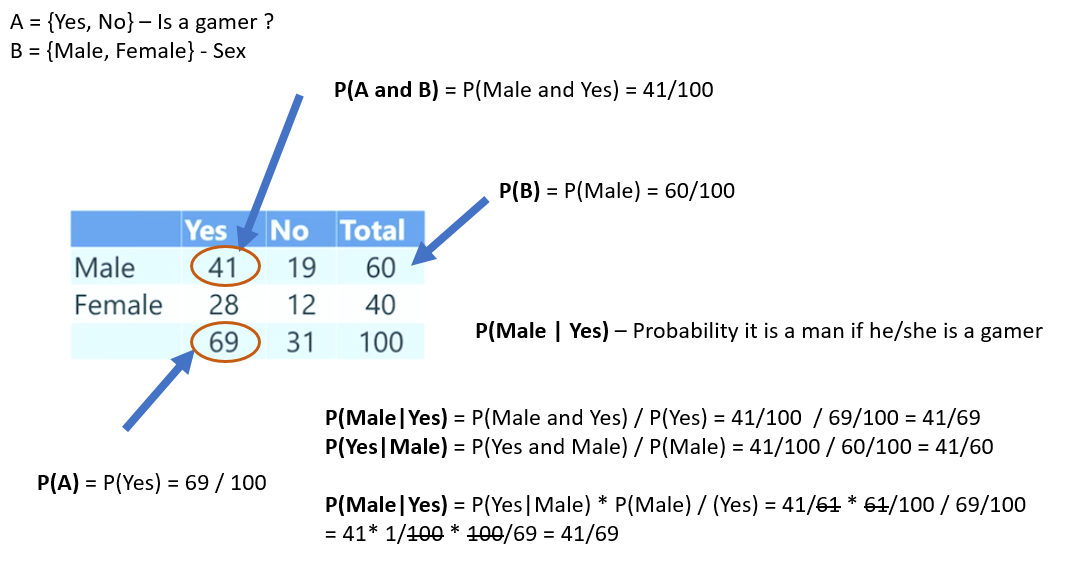
Conditional Probability video
$P(A |B)=\dfrac{P(A \cap B)}{P(B)}$
$P(B |A)=\dfrac{P(B \cap A)}{P(A)}$
Probability of A given B is probability of occur A (for example I'm late of work) when B happend (it's raining - but this situation happend so it has influence of current probability of A).
Conditional Probability is not alternate. $P(A|B)$ is NOT EQUAL $P(B|A)$.
Law of Total Probabilty video example ↶ Example
html source
Example
$P(A)=\sum_{i=1}^{n}P(A|B_i) * P(B_i)$
Probability of occuring event A is sum of probability of occuring event A when B occured times probability of event B.
Bayes Theorem video more ↶ Bayes Theorem
html source
Bayes Theorem
Bayes Theorem - It describes the pobability of an even based on prior knowledge of conditions that might be related to the event. This is usefull when you want to check probability of (A - for example: desease) when we know that second event occur (B - for example: positive test) and know opossite probability P(B|A).
$P(A|B)=\dfrac{P(B|A)*P(A)}{P(B)}$
Contigency Table
Sample and Population video
| Population | Sample |
|---|---|
| Population includes all elements in the datasets. The all statistics in the population (parameters) is the truth, because there is no elements that we don't measure. In reallife in most cases it is impractical to measure the whole population. For example 300 mln people in the United States. | Sample include only part of the population. In most cases if we choose good sample the statistics are close the population. |
Strategies of choosing the sample video
| Simple random sampling | Stratified random sampling | Cluster sampling | Systematic random sampling | Convinient sampling |
|---|---|---|---|---|
| We random select n samples from the population | We divide our population in groups (called strata) (e.g. young, adult,old) and from each group we select our sample. The sample size of each datais propotional to the entire population. (e.g. 20% young, 60% adult, 20% old) | We divide our population in clasters, and all samples are from this one particular sample. Next we can choose all elements from cluster - one stage clustering or random number from cluster - multi stage clustering Cluster must be represantive | We choose first person and "n"-th person from the population "m" times. | When we choose not represantive group (e.g. professor choose students as a sample). The results are no represent the population |
Bias of the sample video
| Selection Bias | non-response bias | publication bias |
|---|---|---|
| Selection bias occurs when each element in the population does not have the same chance of being chosen. Example: * Company select the customers by calling them, but some customers don't have a phone. | Non-response bias occurs when respondents differ in meaningful ways from non-respondents. We have only opinions who response (e.g. extreme opinions) Example: * When we base only on comments, but we don't have opinions from all but only from people with strong opionions. | Publication bias occurs because studies with positive results are more likely to be published than those with negative or null results. (for example failed experiments). Example: * Laboratory publish only positive results of their drug, without any failures * Clinical trials that indicate a new drug is better than an older drug are twice as likely to be published than studies that indicate the new drug is no better. |
| surviorship bias | response bias |
|---|---|
| survivorship bias occurs when a meaningful part of a population is not considered in your sample. Examples: * When you look at successful people, identifying interesting characteristics, such as dropping out of school, and assuming that all successful people must have dropped out of school. Why? Essentially, you're ignoring failures. All those people who dropped out of school and went nowhere when you're interpreting your results of your study. * A study showed that a lower percentage of cats who fell from six or fewer stories survived than cats who fell from more than six stories. The results were based on visits to vet's offices. Why? A larger number of cats falling from grater than 6 stores would not live and not have been included in the sample results. * in World War II engineers noticed that after a mission bullet holes tended to be clustered in the wing, rear gunner and body of returned planes. Why? The study doesn't include planes that didn't return. | Response bias refers to the bias that results from problems in the measurement process, itself. (e.g. tendentious questions) Examples: * When you ask leading questions, when people tell you what they think you want to hear, or when they want to present themselves in a favorable way. * In 2016, SurveyMonkey and NBC administered web surveys to determine the preferences of voters in each state. Suppose 10,000 voters responded in each state. Why? Because we check only persons who response, not all voters |
Calculations video
| For Population | For Sample |
|---|---|
| Population size: $,N$ | Sample size: $,n$ |
| Mean: $,\mu=\dfrac{\sum_{i=1}^{n}x_i}{N}$ | Mean (xbar): $,\bar{x}=\dfrac{\sum_{i=1}^n(x_i)}{n}$ |
| Variance: $\sigma^2=\dfrac{\sum_{i=1}^N(x_i-\mu)^2}{N}$ | Variance: $s^2=\dfrac{\sum_{i=1}^n(x_i-\bar{x})^2}{n-1}$ |
| Standard Deviation: $\sigma=\sqrt{\sigma^2}$ | Standard Devation:$s=\sqrt{s^2}$ |
| Standard Error:$SE=\dfrac{s}{\sqrt{n}}$ |
P-hat video
P-Hat is used when we want to count propotion in the sample. How often event "X" occur. To calculate p hat, our point estimate of the population proportion, we simply take the number of successes in our sample and divide by the total number of sample observations .
| Proportion | Standard Error |
|---|---|
| $\hat{p} = \dfrac{number,of,X,in,sample}{n}$ | $SE(\hat{p})=\sqrt{\dfrac{\hat{p}*(1-\hat{p})}{n}}$ |